 Applications > Using Dashboard > Working with the Siebel Solution > Using the SARM - User Trace Breakdown Diagnostic Tool > Results - Analysis Page > Transaction
Transaction
Click the Transactions tab to open the transactions table.
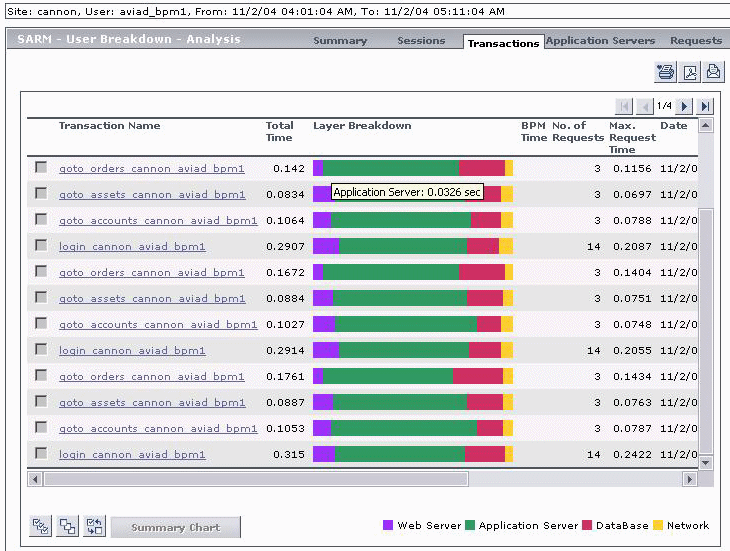
This view is provided only for the user used by the Business Process Monitor, and not for a real user, in order to be able to process this data (for details, see Adding and Editing Transaction Monitors in End User Management Data Collector Configuration). This way, all the requests that belong to that transaction are identified and data can be generated.
Note: You must enable Siebel breakdown for the Business Process Monitor script monitoring your Siebel application. This can be done while configuring the Business Process Monitor transaction in the Admin > Monitors, and selecting Enable Siebel breakdown in the Transaction Breakdown Settings area (for details, see Adding and Editing Transaction Monitors in End User Management Data Collector Configuration).
The page displays the following information for each transaction:
- Transaction Name. The name of the transaction.
- Total Time. The total time the transaction ran in Siebel.
- Layer Breakdown. The breakdown of the layer into its areas relative to the time spend by the transaction in each area: Web Server, Application Server, Database, and Network. Tooltips display the average time the transaction spent in each area.
- BPM Time. This column displays the time the invoked transaction ran in Business Process Monitor (only when the transaction is invoked using Invoke Business Process Monitor Script). This value is larger than the value in the Total Time column as it includes client time, network time, and so forth.
- No. of Requests. The number of transaction requests that ran in this application server.
- Max. Request Time. The maximum time spent by any of the requests in the transaction.
- Date. The date when the transaction ran.
- Session ID. The Id of the session.
- Task ID. The Id of the task the transaction belongs to.
- Application Server. The name of the application server on which the transaction ran.
- Web Server. The name of the web server on which the transaction ran.
Drilling down a transaction will display all the requests that belong to that transaction (for details, see Requests).
Note: The BPM Time is displayed only when the SARM User Session Trace breakdown diagnostics has been run after invoking a BPM script monitoring the Siebel Application. Some additional tuning of Siebel Application\Web Server environment variables is required. This is due to the fact that the flush ratio of SARM files is approximately 5 times slower in the Web Server than in the Application Server, and therefore running SARM with the default value of SARM_MaxFileSize variable may not be enough for the SARM user trace breakdown diagnostic tool to return data (contact Mercury Customer Support for additional information).