 Applications > Using Dashboard > Working with the Siebel Solution > Using the SARM - User Trace Breakdown Diagnostic Tool > Results - Analysis Page > Summary
Summary
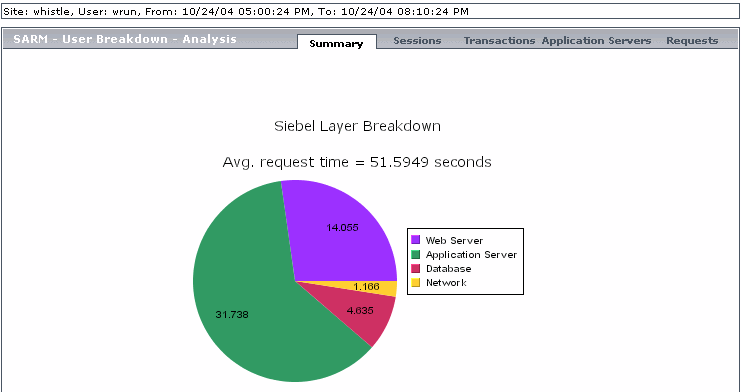
The chart displays the segmentation between the Application Server time, Web Server time, Network time, and Database time for all the requests that were found in the files. For each request, the page displays the timestamp of its session and the average request time.
Note: The drillable data is only accessible through the charts (not through the tables).
Drilling down one of the segments in the chart provides a pie chart that displays the segmentation between the sub areas of that segment. If there is another level of specification (available in Siebel 7.7), you can then drill down to the sub area level. For example, you can drill down the Application Server layer to access the segmentation between the areas of Application Server.

You can then click segments of the Area Breakdown chart to open the corresponding Sub Area Breakdown chart (if it exists).
The breakdown is as follows:
If Mercury Business Availability Center knows the transaction the request belongs to, the page displays the transaction name. The application server time, web server time, database time, and total time are also displayed. If the request belongs to a transaction that was executed by a user request in the previous page, Business Availability Center for Siebel also provides the Business Process Monitor time of that transaction. You can also run the Transaction Analysis report for the transaction (for details, see Transaction).
You can click any part of the chart to get the tooltip that indicates the time the transaction spent in the layer, area, or sub area.