 Applications > Using Dashboard > Working with the Siebel Solution > Using the SARM - User Trace Breakdown Diagnostic Tool > Results - Analysis Page > Requests
Requests
Click the Requests tab to open the requests table. You can also access this page by clicking a session ID in the Sessions main page, or by clicking an application name in the Applications main page.

The page displays the following information for each request:
- Request ID. The ID of the request. You can drill the request ID to display information about the area where the request ran (for details, see Displaying the Area Details).
- Transaction Name. The name of the transaction the request belongs to.
- Total Time. The total time spent to execute a request.
- Layer Breakdown. The time consumption breakdown by layers into its areas relative to the time the request spent in each area: Web Server, Application Server, Database, and Network. Tooltips display the average time the request spent in each area.
- BPM Time. This column displays the time the invoked request ran in Business Process Monitor (only when the request is invoked using Invoke Business Process Monitor Script). This value is larger than the value in the Total Time column as it includes client time, network time, and so forth.
- Date. The date when the request ran.
- Session ID. The ID of the session on which the request ran.
- Task ID. The ID of the task the request belongs to.
- Application Server. The name of the application server on which the task ran.
- Web Server. The name of the web server on which the task ran.
Note: Scroll to the right to see the rest of the information.
Note: The BPM Time is displayed only when the SARM User Session Trace breakdown diagnostics has been run after invoking a BPM script monitoring the Siebel Application. Some additional tuning of Siebel Application\Web Server environment variables is required. This is due to the fact that the flush ratio of SARM files is approximately 5 times slower in the Web Server than in the Application Server, and therefore running SARM with the default value of SARM_MaxFileSize variable may not be enough for the SARM user trace breakdown diagnostic tool to return data (contact Mercury Customer Support for additional information).
You can select one or more requests and click Summary to display a summary chart for the requests you selected.
Use the Select all, Invert selection, and Select none buttons (shown below) to help you select the sessions.

For more details on the summary chart, see Summary.
Displaying the Area Details
In the request details page, click a request ID to display information about the areas where the request ran.
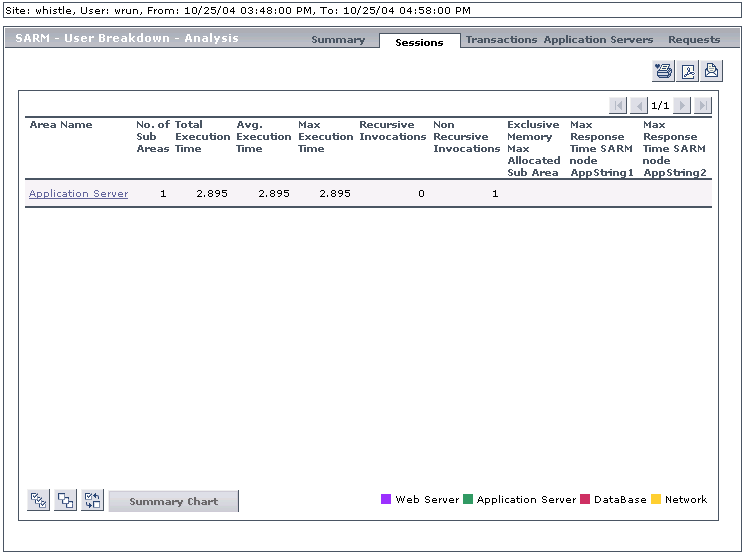
The page displays the following information:
- Area Name. The name of the area where the request ran. You can drill the area name to display information about its sub areas (for details, see Displaying the Sub Area Details).
- No. of Sub Areas. The number of sub areas in the area.
- Total Execution Time. The total time spent by the request executing in the area.
- Avg. Execution Time. The average time spent by the request executing in the area.
- Max Execution Time. The maximum time spent by the request executing in the area.
- Recursive Invocations. The number of times requests were invoked by other requests (recursive invocation) in the area.
- Non-Recursive Invocations. The number of times requests were invoked (non-recursive invocation) in the area.
- Exclusive Memory Max Allocated Sub Area. The amount of memory used by requests that entered only this area.
- Max Response Time SARM node App String 1. The name of the method invoked or workflow process involved.
- Max Response Time SARM node App String 2. The name of the method invoked or workflow process involved.
Displaying the Sub Area Details
In the area details page, click the area name to display information about its sub areas where the request ran.

The page displays the following information for each sub area:
- Sub Area Name. The name of the sub area where the request ran. You can drill the sub area name to display information about the session requests (for details, see Displaying Instance Details).
- Area Name. The name of the area where the sub area is located.
- No. of Instances. The number of instances of the request.
- Total Execution Time. The total time spent by the request executing in the sub area.
- Avg. Execution Time. The average time spent by the request executing in the sub area.
- Max Execution Time. The maximum time spent by the request executing in the sub area.
- Recursive Invocations. The number of times requests were invoked by other requests (recursive invocation) in the sub area.
- Non-Recursive Invocations. The number of times requests were invoked (non-recursive invocation) in the sub area.
- Exclusive Memory Max Allocated Instance. The amount of memory used by requests that entered only this sub area.
- Max Response Time SARM node App String 1. The name of the method invoked or workflow process involved.
- Max Response Time SARM node App String 2. The name of the method invoked or workflow process involved.
Note: Scroll to the right to see the rest of the information.