 Applications > Using Dashboard > Working with Dashboard > Dashboard Console > Understanding the Console Tab Page
Understanding the Console Tab Page
The Console tab page shows the components of the active Dashboard view organized into the same hierarchy tree format that you defined for the CIs in Dashboard Administration. For details, see Working with CIs in IT Universe Manager in IT Universe Manager Administration.
The tree is built from group CIs (parents and children) and monitor CIs.
The KPI columns for the view (for example, System, Performance, and Availability) contain colored indicators representing performance status for each CI under that KPI (if the KPI is applicable for the CI). Note that if a KPI is relevant for at least one CI in the tree branches currently displayed, then that KPI is displayed for all CIs. The KPIs that are not relevant for a particular CI display a hyphen (-) meaning that the KPI is not applicable for this CI.
For an explanation of the status icons, see Understanding KPI Status in Using Dashboard.
Tip: Hold the cursor over the entry in the CI Name column to display the full name of a CI in a tooltip.
This section includes the following topics:
Navigating in the Tree
The Console tab top level displays the view and the status of the top level CIs' KPIs. The tree pane provides a "snapshot" of tree branches at two consecutive levels (configurable default). When you first access the view, if there is only one parent, you see the two highest levels: Mercury Tours Business (parent) and Springfield and Unionville (children).
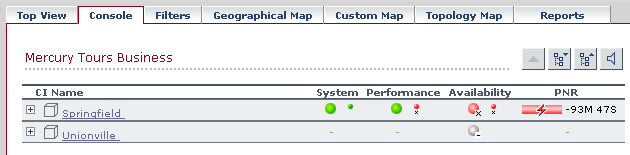
If there is more than one child, all CIs are shown collapsed when you first access the view.
You can expand each CI individually to show the child CIs for that CI, or you can use the Expand All/Collapse All buttons
 to expand all CIs in the view (so that you see child CIs for all CIs). Note that these buttons are shown only when one or more of the currently displayed CIs can be expanded or collapsed.
After a CI is expanded using either of these methods, it remains expanded for as long as the browser window is open, even if you move to another Mercury Business Availability Center application.
If you move from another tab to a CI in the Console tree pane (for example, by clicking a CI name in the Filters tab, or by selecting an option from a CI options menu), then the relevant CI name is shown highlighted in the tree (and in the View Explorer), and the CI is shown expanded. However, CIs expanded in this way do not retain the setting and are collapsed again when you move away from that level of the view.
To view the CIs two levels down from the current CIs, click a drill-down link (linked CI name). CIs are displayed as drill-down links if there is at least one level below the CI, or if there is at least a CI with child CIs within the same branch. In the above example, the CIs Springfield and Unionville are shown as drill-down links because Mercury Tours Business is a CI with child CIs. Click Springfield to display the CI's child CIs. The view of the tree changes; Springfield is shown as the parent CI and the level under the selected CI is displayed.

The CIs at the new level are by default shown collapsed; however, if the displayed level contains only one parent CI, or if you have previously expanded CIs, then the child CIs are shown for the relevant CIs.
Tooltips
Hold the cursor above the icon to display a tooltip that provides more information about the change:

The tooltip includes the following information:
- CI Name. The name of the CI.
- Status. The status of the CI (calculated according to one of the status calculation methods). It may also display:
- Not up to date. For decayed CIs, indicating that the CI has passed its timeout period. (For a SiteScope CI, this status is displayed after a SiteScope monitor is disabled.)
- Stopped. When a Business Process profile is stopped.
- Calculation Rule. The name of the rule that calculates the KPI status or value.
- Held Status Since. The date and time since which this CI has held its current operational status.
- Invisible Children. Might not appear. The number of child CIs belonging to other views, which are connected to this CI but do not belong to this view – Editing CI Properties in IT Universe Manager Administration.
Sound Alert for Critical Status
Dashboard provides the option to have a sound play when a CI changes status to Critical (red), to provide an aural notification of the change in status.
The Sound On/Off button
 is displayed in the top right corner of the Console tab. Click the button to toggle the sound on or off.
The icon tooltip indicates the action you will perform if you click the button.
When the sound is switched on, a sound alert is played when the Console is currently displayed and a CI's KPI changes status to Critical (red). The Critical status icon is also shown flashing until the next screen refresh.
Note the following additional conditions:
- The sound is played only if the status of a CI's KPI in the currently displayed tree branches has changed to Critical. If a CI in a hidden part of the view has changed to Critical but does not change the status of any of the CIs in the currently displayed branches, no sound is heard.
- If the view is being loaded for the first time, no sound is played for the CI's KPIs that are loaded at Critical status.
Note: The alert sound is a .wav file downloaded by the browser. If you are using Mozilla, you must download a plug-in for playing .wav files, otherwise no sound will be heard.
The default alert sound can be changed by users with administrative permissions.