Applications > Using Dashboard > Working With Deep Transaction Tracing > Deep Transaction Tracing Reports
Deep Transaction Tracing Reports
From the Deep Transaction Tracing view, you can access reports in the TransactionVision application that provide you with breakdown information for the transaction at component level.
The reports are opened from the menu options for a Deep Transaction Tracing Monitor CI in the Console and Filters tabs: Select Deep Transaction Tracing Reports, then select the required report type from the displayed list. TransactionVision opens in a new browser window, displaying the selected report for the relevant transaction.
The available report types are discussed in the following topics. For more detailed information on each report, and how to set viewing options, refer to the TransactionVision documentation, available from the Help menu in the TransactionVision application.
This section includes the following topics:
Tracking Report
The Tracking Report menu option opens the Transaction Tracking Report, which lists information for every instance (run) of the Business Process Monitor transaction over a specified time period. The displayed information includes start time, response time, and the result of the run.
To see more detailed breakdown of behavior on the target machine for a run of the transaction, click the Tx Class link to drill down to the Transaction Details report; from there, click an event link to drill down to an event details report.

Service Level Report
The Service Level Report menu option opens the Service Level Analysis report, which provides a graphical view of response time for the transaction over time. The displayed information includes average response time, maximum response time, and transaction volume over each reporting time period.

Note: You need Adobe SVG Viewer 3 installed on your local machine to see the Service Level Analysis report. Download from the Adobe Web site.
Component Topology Report
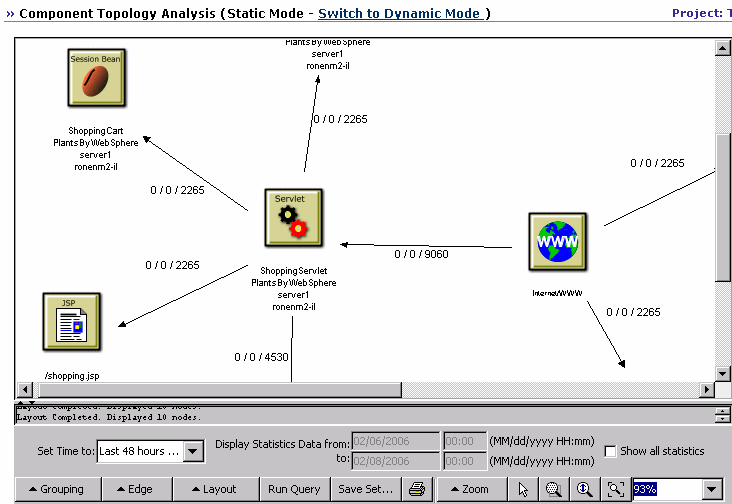
The Component Topology menu option opens the RTM report, which displays a top view map for the flow of information across components in the target machine, over a specified time period. The report shows activity for all components on the machine during the time period, not for any individual transaction. The report also displays statistics on the interaction between components (for example, failed, late, and total counts for events).