Applications > Using Dashboard > Dashboard Reports > Raw Data Over Time Report > Understanding the Raw Data Over Time Report
Understanding the Raw Data Over Time Report
The Raw Data Over Time report displays Business Process Monitor raw data in:
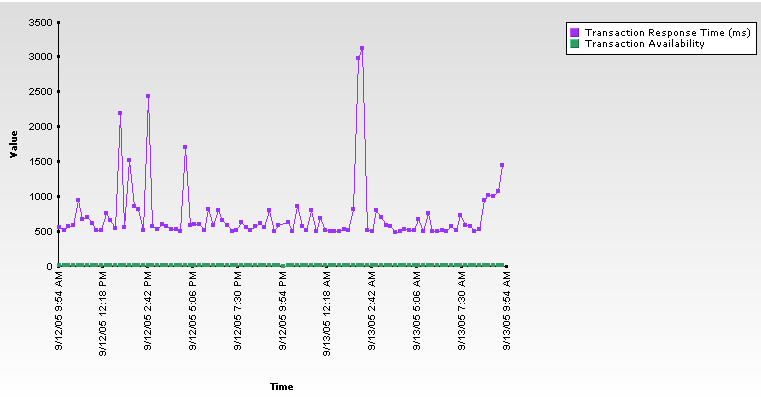
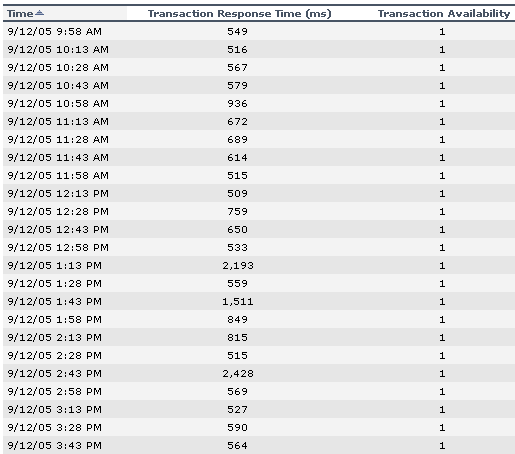
The type of information displayed in the report depends on the type of CI you select. For more details about Business Process Monitor CIs, see Raw Data Over Time Reports for a Business Process Monitor Source. For more details about SiteScope CIs, see Raw Data Over Time Reports for a SiteScope Monitor Source.
This section includes the following topics:
Raw Data Over Time Reports for a Business Process Monitor Source
The Raw Data Over Time report displays raw data over time for selected configuration items, received in the data samples from Business Process Monitor sources for the transaction from location CIs.
You can work in two different modes by selecting the Transactions/Locations or the Regular hierarchy for the Business Process Monitor source. For details, see Business Process Monitoring in Source Manager Administration.
- If you select the Transactions/Locations hierarchy, you can select the transaction from location in the filter. You can then triage the problem by checking the transaction breakdowns and comparing the results of this transaction from different locations.
- If you select the Regular hierarchy, you can select only the transaction in the report filter. The report helps you understand at what time the transaction response time was poor and why it was poor. In the report table and graph, the data from all the locations is displayed, sorted by time, in the same graph or table, without location information.
- The BPM either reports Network and Server Time to First Buffer separately, or reports Time to First Buffer as a whole; hence the Network Time to First Buffer, Server Time to First Buffer, and Time to First Buffer never return values on all three.
- The GDE Sample is trans_t for all the raw data measurements.
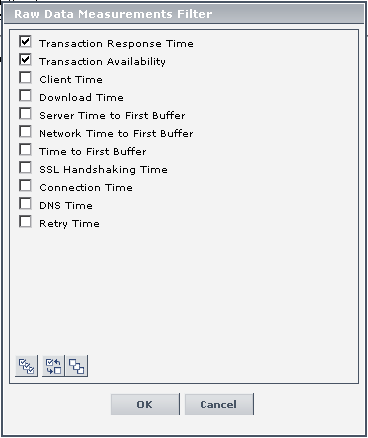
Usually, if the Response Time and Availability raw data measurements are available for the CI, they are automatically selected. The other raw data measurements that are listed are breakdown raw data measurements for the Business Process Monitor transaction from location.
The table displays the following information:
|
Item
|
Description
|
|---|---|
|
Time
|
The sampling time.
|
|
Transaction Response Time (ms)
|
(Business Process Monitor raw data measurement)
The transaction response time in milliseconds. This raw data measurement is selected by default. All measurements where the transaction was not available are removed from the report.
|
|
Transaction Availability
|
(Business Process Monitor raw data measurement)
The availability of the transaction. For details, see Raw Data Over Time Report. This raw data measurement is selected by default. Only the unavailable transactions are displayed (their value
is 1). |
|
Client Time
|
(Business Process Monitor raw data measurement)
Displays the average amount of time (in milliseconds) that passes while a request is delayed on the client machine. Client-related delays can include browser think time, CPU think time, HTML page processing time, time needed to open sockets, application delays caused by heavy applets, and so forth.
Note: Client time is calculated by subtracting all other measured times from the total transaction time.
|
|
Connection Time
|
(Business Process Monitor raw data measurement)
Displays the average amount of time (in milliseconds) needed to establish an initial connection with the Web server performing the transaction. The connection measurement is a good indicator of problems along the network or whether the server is responsive to requests.
|
|
DNS Time
|
(Business Process Monitor raw data measurement)
Displays the average amount of time (in milliseconds) needed to resolve the DNS name to an IP address, using the closest DNS server. The DNS Lookup measurement is a good indicator of slow DNS resolution or other problems with the DNS server.
|
|
SSL Handshaking Time
|
(Business Process Monitor raw data measurement)
Displays the average amount of time (in milliseconds) taken to establish an SSL connection (includes the client hello, server hello, client public key transfer, server certificate transfer, and other—partially optional—stages). After this point, all the communication between the client and server is encrypted.
The SSL handshaking measurement is only applicable for HTTPS communications.
|
|
Network Time to First Buffer
|
(Business Process Monitor raw data measurement)
Displays the average amount of time (in milliseconds) that passes from the moment the first HTTP request is sent until receipt of ACK. The network measurement is a good indicator of network quality (look at the time/size ratio to calculate download rate).
|
|
Server Time to First Buffer
|
(Business Process Monitor raw data measurement)
Displays the average amount of time (in milliseconds) that passes from the receipt of ACK of the initial HTTP request (usually GET) until the first buffer is successfully received back from the Web server. The server time to first buffer measurement is a good indicator of Web server delay.
Note: Because server time to first buffer is being measured from the client, network time may influence this measurement if there is a change in network performance from the time the initial HTTP request is sent until the time the first buffer is sent.
|
|
Time to First Buffer
|
The sum of Network Time to First Buffer and Server Time to First Buffer.
|
|
Download Time
|
(Business Process Monitor raw data measurement)
Displays the time that passes from the receipt of the first buffer until the last byte is received.
Download time is a combination of server and network time, since the server typically sends data over multiple connections, and is therefore working while data is being transmitted over the network.
|
|
Retry Time
|
(Business Process Monitor raw data measurement)
Displays the overall amount of time that passes from the moment an HTTP request is started until the moment an HTTP or TCP error message is returned. Retry time relates only to HTTP or TCP errors that execute a retry after the error.
|
All raw data measurements (except for Transaction Response Time and Transaction Availability) are all weighted breakdowns, as they appear in the Transaction Breakdown Report, and by default they are not selected. For details, see Understanding the Transaction Breakdown Reports in Using End User Management.
Note:
Best Practices for Raw Data Over Time Reports for a Business Process Monitor Source
This section provides tips that will help you use the Raw Data Over Time Report in the most efficient way. You must first decide whether it is worth using the Raw Data Over Time report, then configure the data collectors, and then analyze the report to find where the problem occurs.
To decide if you should use the Raw Data Over Time report:
- Do not use on a daily basis:
- This report should not be used on daily basis. In order to get an overall picture about the monitored application open End User Management reports. End User Management report shows the general trend of the applications performance and availability.
- The Raw Data Over Time report is not efficient when the Business Process Monitor is configured to report data at low frequency. For example, if the Business Process Monitor agent reports data every 15 minutes, all the data can be seen in End User Management reports, and there is no need to open the Raw Data Over Time report.
- Use the Raw Data Over Time report when there are performance/availability problems:
- When the monitored application is actually having performance and/or availability problems.
- The end users complain about the bad performance, but there is no indication of any problem in the Business Process Monitor reports in End User Management.
- There seems to be a problem between transaction scheduled runs. To detect when exactly the performance problem happens, increase the frequency to every half minute.
- If the peaks appear during a specific minute, it is very difficult to detect it in the End User Management reports, which usually display the average of all the transactions in the specific time frame. If more than one transaction appears in the time frame the average result may hide the peak you are looking for.
- In such a case, to see all the reported data, open the Raw Data Over Time report.
To configure the data collectors in the most efficient way:
- In Monitoring Administration set Enable Breakdown for the relevant
transactions - for details, see Adding Transaction Monitors in End User Management Data Collector Configuration. - To detect the peaks in application performance increase the frequency of the Business Process Monitor. The recommended frequency is one minute.
- Change the frequency in all the reporting locations.
- Select Admin > CMDB, click Source Manager, click the Edit button to the right of the Business Process Monitoring source adapter, and select Transaction/Location in the Hierarchy structure list, and click OK.
To analyze the report when there is a periodic behavior:
- Open the Raw Data Over Time report and select the time period where you expect to find the problems. Since the report displays large amount of data, it is recommended to select short time periods. A time period of one day should be enough to find a periodic behavior.
- To better see the results, enlarge the report size in the advanced settings.
- Once you detect a peak, travel with the navigations buttons to a previous day and to the day before that. Try to find out whether the bad performance problem appears at the same time each day.
To analyze the report when there is a problematic behavior:
Raw Data Over Time Reports for a SiteScope Monitor Source
The Raw Data Over Time report shows data that is reported to Mercury Business Availability Center from the Business Process Monitor. The main goal of the report is to enable you to analyze application performance and availability at crisis's time. The biggest difference between the Raw Data Over Time report and the End User Management report is that the Raw Data Over Time report displays only raw data, which means that all the data that was reported to Mercury Business Availability Center will be shown in the Raw Data Over Time report. No calculations are made over the reported data.
The Raw Data Over Time report displays raw data over time for selected configuration items, received in the data samples from SiteScope Monitor, SiteScope Measurement Group, and SiteScope Measurement CIs.
The SiteScope Monitor CI is used by Mercury Business Availability Center when the SiteScope source adapter is configured not to include Measurements. The SiteScope Measurement Group CI and the SiteScope Measurement CI are used when the source adapter is set to include measurements. For details about the source adapter, see SiteScope in Source Manager Administration.
Different sets of KPIs are displayed in the report depending on the type of CI you selected. The KPIs available for SiteScope Monitor or SiteScope Measurement Group CIs are exactly the measurements that are reported by SiteScope to Mercury Business Availability Center. The KPIs are named according to the Measurement names. There are no explicit units for SiteScope KPIs, but in most cases there are implicit unit indications in the KPI name (for example, MB Free). The raw data values are all taken from the ss_t GDE Sample and from the dValue field. For details, see Sitescope Measurement Rule in Application Administration.
The report displays the following information:
- If you select a SiteScope Measurement Group CI, the measurements are used as KPIs.
- If you select a SiteScope Measurements CI, a single KPI that corresponds exactly to the measurement is displayed.
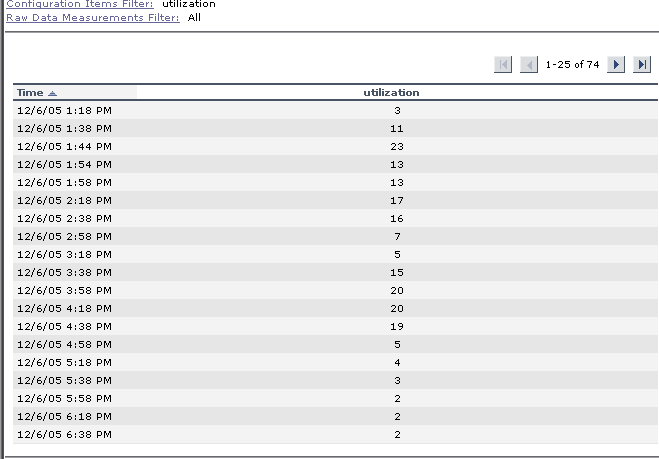
For example, if the SiteScope Measurement Group is cpu on bilbo, whose measurements are: utilization, utilization cpu #1, and utilization cpu #2, the Raw Data Over Time Report displays the measurements as KPIs.
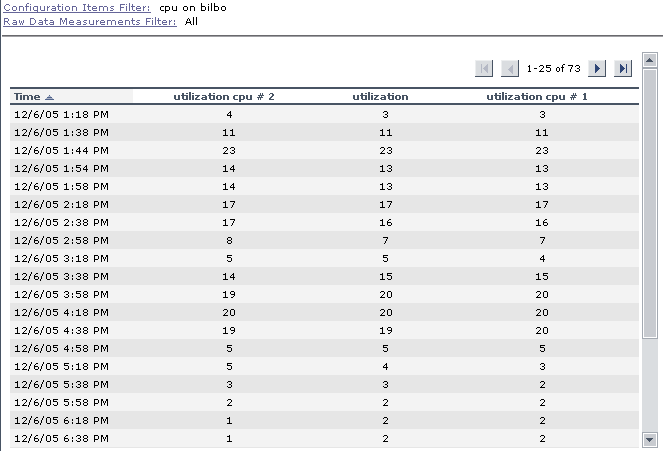
For example, if the SiteScope Measurement is utilization, the Raw Data Over Time report displays the measurement as KPIs
Filtering by Raw Data Measurements
To filter a report for specific raw data measurements, you must select them.
If a selected CI does not have raw data measurements, the message No applicable measurements is displayed near the Raw Data Measurements Filter.
Availability is always 0 or 1 as each point in the report represents one transaction run that was either successful (1) or failed (0). You can use this capability to pinpoint exactly when the transaction failed.
To filter by Raw Data Measurements:
Selecting Advanced Options
The advanced options enable you to manipulate the report size and the report scale.
To select Advanced Options:
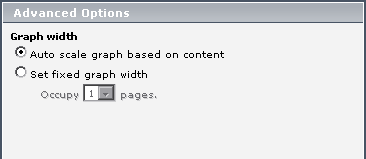
- Click Advanced Options to open the Advanced Options dialog box.
- Select one of the following:
- Auto scale graph based on content - This causes the graph to auto scale based on a fixed number of points, depending on the type of view you selected in the View box.
- Set fixed graph width - The graph is displayed with the width you select in the Occupy ... pages list. The values are in pages in a range from 1 to 8. You can display the report pages one after the other by scrolling the report horizontally.
- Select OK to save the changes.
Tooltips
The tooltip displays the raw data measurement, the sampling time, the sampling value, and its unit.