 Applications > Using Dashboard > Dashboard Reports > KPIs Over Time Report > KPIs Over Time Reports with Value Data
KPIs Over Time Reports with Value Data
If you select the View Value over Time option when you generate a KPIs over Time report, the report displays only the values of the relevant KPIs. Those KPIs may also have statuses in CMDB but the value report will not show those statuses.
Reports of this type are relevant for KPIs with business rules that calculate meaningful values, such as rules for calculating percentage, volume, financial impact, or Real User Monitor values.
You can select the number of sampling points in the Every boxes.
The report can be displayed as a graph or as a table:
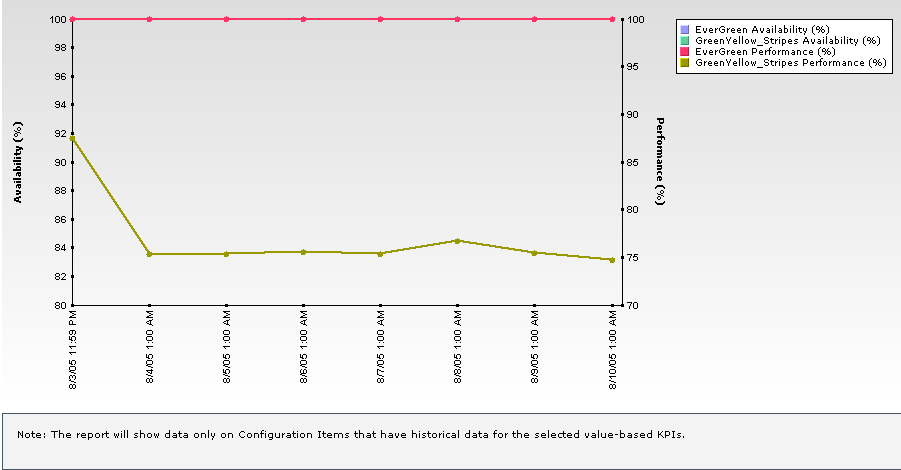
- View as Graph - Each KPI instance is represented by a separate graph. The legend lists the color followed by the name of the CI and a specific KPI. If a CI data is shown in more than one graph, the CI has the same color in all the graphs.
- View as Table - The table shows the list of all filtered CIs and KPIs. Only existing KPIs should appear.

If only two KPIs are selected for one CI, the first KPI appears as the left y-axis and the second KPI as the right y-axis. This is helpful for correlating an event.
If only one KPI is presented in each chart, the KPI objectives are shown as horizontal colored lines (the colors correspond to the objective colors) as follows:
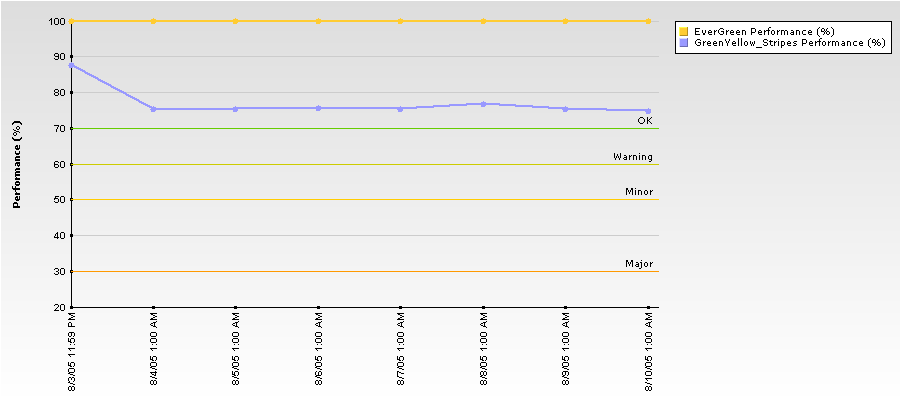
Note: All values in the graph are averaged by time frame.
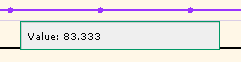
Tooltips are available for each point in the graph and display the exact data for the point.
You can drill down each point in the graph to display the data in the period of time that corresponds to your selection. For example, if you have selected to display information every day for the past week, then drilling down on one point displays the detailed information for every hour of the selected day, and then drilling down on one hour displays the detailed information for 5 minutes intervals in the hour, and so forth down to a minute interval.
The table displays the selected CIs and KPIs values in the selected time period.
You can sort the CIs and KPIs by clicking the relevant column header.