 Applications > Using Dashboard > Dashboard Reports > KPIs Over Time Report > KPIs Over Time Reports with Status Data
KPIs Over Time Reports with Status Data
If you select the Statuses option when you generate a KPIs Over Time report, the report displays only the status of the relevant KPIs. Those KPIs may also have values in the Mercury Universal CMDB but the status report will not show those values.
The reports can be displayed in graph or table format:
- View as Graph - The graph shows all the selected CIs and KPIs.

- to a specific segment of the time period. For details, see Drilling Down by Time Segments in Status KPIs Over Time Reports.
- to display status information about the children that contribute to the status of the selected CI's KPI. For details, see Drilling Down to Influencing Children.
- to display status information about the parents of the CI whose status is influenced by the status of the selected CI's KPI. For details, see Drilling Down to Influenced Parents.
- View as Table - The table shows all the selected CIs and KPIs. When you select CIs and do not select specific KPIs, all the KPIs that have been attached to the selected CIs are displayed.

When you select CIs and do not select specific KPIs, all the KPIs that have been attached to the selected CIs and have historical data in the database are displayed.
The graph displays the following information:
You can drill down:
Tooltips are shown for each status. The background of the tooltip reflects the color of the status according to the KPI's objectives.
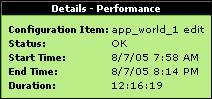
The tooltip displays the following information:
The table displays the following information:
The table shows the list of all the events sorted by CI by default. You can sort the table by different elements by clicking the relevant column header.
Note: The number of lines that can be displayed in the table is not limited. This might slow performance when displaying the table; in such cases it is recommended to limit the time period or the number of CIs and KPIs you want to display.
This section includes the following topics:
Drilling Down by Time Segments in Status KPIs Over Time Reports
Click any time segment in the graph time footer to drill down (zoom) on all the CI and KPI information for that period of time. The time segment you zoom on is split into four equal parts that can also be zoomed until each time segment is one minute long.
The From date and time of the segment you select becomes the From date and time of the whole time footer and the To date and time of the segment you select become the To date and time of the whole time footer.
For example, if the time period you selected is from 7/13/05 6:14 AM till 7/13/05 4.:44 PM, the time footer is split into four equal segments as follows:
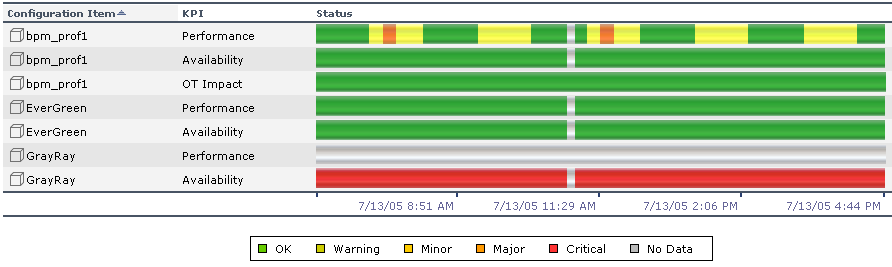
If you drill down on the first segment of the time footer, the From date and time of that segment is 7/13/05 6:14 AM, and its To date and time is what is indicated under the second tick of the time footer: 7/13/05 8:51 AM.
The drilled down report time From and To fields display those dates and times, and the time footer of the report displays this period of time split into four equal parts: (8:51-6:14)/4=39 mn. The first part starts at 6:14 AM, and ends 6:14+:39=6:53, the second part starts at 6:53 and ends at 6:53+:39=7:32, and so forth:

Drilling Down to Influencing Children
Click the Drill to influencing children button
 for a specific CI's KPI to display status information about the children that contribute to the status of the CI's KPI.
For example, the view has the following hiearchy.
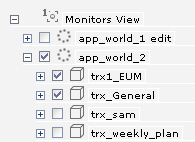
If you drill down the app_world_2 CI and the Performance KPI, the information that is displayed is the status of all the Performance KPIs for all the children of the app_world_2 CI that have a Performance KPI and of the parent itself.
If you click the Drill to influencing children button
for the app_world_2 CI and the Performance KPI in the following graph:
then the drilled down report displays the status of all the Performance KPIs for all the children of the app_world_2 CI that have a Performance KPI as follows:
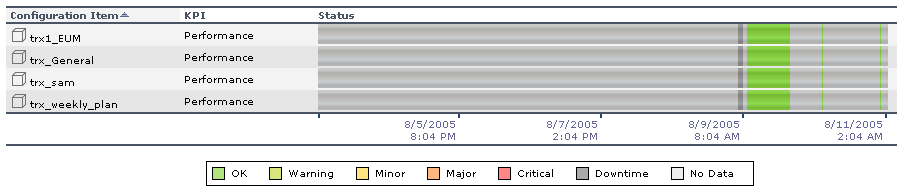
If the selected CI and KPI do not have influencing children, then the report displays the message: No influencing children found.
Drilling Down to Influenced Parents
Click the Drill to influenced parents button
 for a specific CI's KPI to display status information about the parents of the CI whose status is influenced by the status of the selected CI's KPI. A CI may have more than one parent but the parent CIs that are displayed in the report are the parent CIs that are part of the view.
For example, if you drill down to influenced parents for the trx_weekly_plan CI and the Availability KPI, the information that is displayed is the status of all the Availability KPIs for all the parent(s) of the trx_weekly_plan CI and of the influencing child.

The report about the status of trx_weekly_plan CI displays information about the Availability and Performance KPIs as follows:

If you drill down to influenced parents for the Availability KPI, the report displays the status of the Availability KPI for the app_world_2 CI (parent of trx_weekly_plan CI) as follows:

If the selected CI and KPI do not have influenced parents, then the report displays the message: No influenced parents found.