 Administration > Application Administration > Repositories Administration > Business Rules Repository > Status Calculations
Status Calculations
Every KPI can hold three icons: real time status, trend, and history.
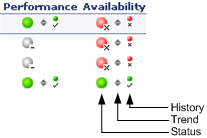
The way status is determined for these icons is described in the following sections:
Status Scores
Real-time statuses can be:
In most rules, only the main three statuses (0, 10 and 20) are used.
When a score has been calculated from more than one value, the scores are assigned status using the following definitions:
They are then assigned the colors:
History Calculation
The history status icon displays either the worst status or the average status for the CI's KPI during a specified time period.
The calculation method for history status is determined by the value set for the HistoryType parameter (one of the global parameters in the Business Rules Repository, described in Rule Global Attributes). The possible calculation methods are Worst (default value) or Average. Whichever calculation method is used, only status scores that have meaning (scores 0 to 20—the non-gray icons) are taken into consideration.
- Worst - consists in taking the worst status over the period of time specified in the HistorySize parameter (also one of the global parameters)
- Average - The Average calculation consists in taking the average status over the period of time specified in the HistorySize parameter (Simple Moving Average). The calculation result is rounded to the nearest of the following values: 0, 5, 10, 15, or 20.
For example: if HistorySize is 60 minutes (default value) and the KPI's values for the last 60 minutes are: 10, 10, 5, 0, -2, 20, the worst status is 0, so the history icon is red.
For example: if HistorySize is 60 minutes and the KPI's values for the last 60 minutes are: 10, 10, 5, 0, -2, 20, the Average status is 10 (rounded from (10+10+5+0+20)/5=9), so the history icon is yellow.
Trend Calculation
The trend status icon shows the trend in real-time status for the CI KPI, using three directions: up, down, and no change.
Trend analysis is performed by comparing the Simple Moving Average (SMA) value for a long window with the SMA for a short window. If the short window SMA is higher than the long window SMA, the trend is considered to be up. If the long window SMA is higher, the trend is considered to be down. The SMA is calculated only on status scores that have meaning (scores 0 to 20—the non-gray icons).
- Long window SMA - based on the mean status of a KPI over the period of time specified in the HistorySize parameter (default = 60 minutes), one of the global parameters in the Business Rules Repository, described in Rule Global Attributes
- Short window SMA - based on the mean status of a KPI over the period of time defined by (TrendRate * HistorySize). The TrendRate parameter (default = 0.3) represents the time rate between the long and short window, and is defined in the hidden parameters described in Modifying the Trend and History Status Calculations
Modifying the Trend and History Status Calculations
You can modify the way the trend and history statuses are calculated and displayed, by editing certain rule parameters. A rule parameter can be set in three places:
- as part of the global rule parameters that apply to all rules and affect all CIs - for details on editing global parameters, see Configuring the Rules Global Parameters
- directly for a rule, so that it affects all CIs that use this rule - for details on editing rule parameters, see Specifying the Rule Details
Some of the parameters for trend and history statuses are predefined and can be viewed and edited in the Business Rules Repository page; others are "hidden," but can be manually added on the Repositories tab if you want to override the parameter default value.
Business Rules Repository Parameters
You can modify various global parameters for trend and history status in the Business Rules Repository, as follows:
For details, see Rule Global Attributes.
Note that the global parameters can be overridden by defining a different value for the relevant parameter within a specific rule.
Hidden Parameters
The history and trend statuses use the following "hidden parameters." These are parameters with default values that are not visible to the user. However, if necessary, they can be overridden by defining the parameter in the global parameters for the Business Rules Repository (described in Configuring the Rules Global Parameters).
The CalculationGranularity parameter determines how many calculations will be performed for a CI in a certain period of time. During normal functioning, Dashboard or Service Level Management perform the calculation approximately every 20 seconds (~180 calculations/hour). If Dashboard or Service Level Management is running without a problem, there is no reason to change the default value.
If Dashboard or Service Level Management has a heavy calculation load, causing the calculations to take more time, Dashboard or Service Level Management might automatically adjust the granularity to calculate less often. For example, calculation may take place every minute or more, meaning 60 or less calculations an hour. If this is a problem, you can define the CalculationGranularity parameter above, to override the automatic granularity rate; however, this modification should be made with great caution, and only by advanced users. Contact Mercury Customer Support for assistance.
Note: If the CalculationGranularity parameter is not changed when there is a heavy calculation load, this will not cause wrong results, but note that calculations will be done on a longer time scale (for example, calculation may be done on a history size of three hours instead of one hour).