 Administration > Application Administration > Repositories Administration > Dashboard KPIs Details > Locations
Locations
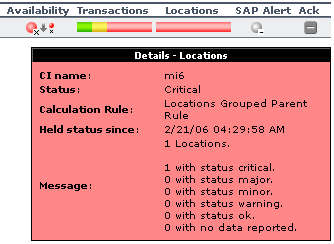
At the group level, displays the worst status of all the children CIs. The Locations KPI is a bar that includes up to six colored sections. Each colored section represents the relative amount of Business Process Steps with the worst status of all the children CIs, that corresponds to the color, at that location. This KPI is dedicated for the SAP System.
At the monitor level, displays the worst status of the Performance and Availability KPIs for the CI. The Locations KPI is a bar that includes up to six colored sections. Each colored section represents the relative amount of Business Process Steps with the end-user experience status (the worst status between Performance and Availability) that corresponds to the color, at that location. The colors correspond to the Business Process Monitor Performance/Availability colors.
For example, if there are ten SAP Business Process Steps under the Locations container, five with Informational end-user experience, two with Minor status, two with Critical status, and one with No Data status, the bar will be: 50% green, 20% yellow, 20% red, and 10% gray.
The KPI's tooltip displays a list of how many locations have each status, and the total number of locations. The tooltip's color is set according to the worst location status.
Rules
The following rules are applicable to this KPI: